2025 results
2024 was a year of contrasts, from a geopolitical, macroeconomic and sectoral point of view. The spectacular fall in residential property following the interest rate hike, unprecedented in its scale and speed, was followed by a loss of investor confidence. Although our order intake remained at a good level in the 1st quarter, the dissolution of the French National Assembly was immediately reflected in a net halt to investment, both in M&A and, more broadly, in all investment projects by major industrial and logistics clients.


A consolidated balance sheet
| 2024 | 2023 | |
| Non-current assets | 567.136 | 539.136 |
| Current assets | 401.596 | 401.562 |
| Total assets | 968.731 | 940.698 |
| Shareholders' equity - Group share | 227.652 | 217.763 |
| Minority interests | 2.915 | 3.445 |
| Non-current liabilities | 428.011 | 383.052 |
| Current liabilities | 310.153 | 336.439 |
| Total liabilities | 968.731 | 940.698 |
Net financial debt
| 2024 | < 1 year | From 1 to 5 years | > 5 years | 2023 | |
| Borrowings and financial debts | 399.019 | 87.164 | 146.843 | 165.013 | 354.297 |
| Available cash | 31.590 | 31.590 | 67.574 | ||
| Net financial debt | 367.429 | 55.574 | 146.843 | 165.013 | 286.723 |
Cash flow statement
| 2024 | 2023 | |
| 1/ OPERATING ACTIVITIES | ||
| Cash flow from operations of consolidated companies | 31.621 | 26.080 |
| Dividends received from associates | 1.779 | 3.080 |
| Change in operating working capital requirement | -72.690 | -19.410 |
| Change in cash flow from operating activities | -39.290 | 9.749 |
| 2/ CAPITAL EXPENDITURE | ||
| Acquisition of fixed assets | -11.249 | -102.733 |
| Disposal of fixed assets, net of tax | 5.948 | 9.653 |
| Impact of changes in consolidation scope | 1.162 | 5.437 |
| Net cash used in investing activities | -4.139 | -87.643 |
| 3/ FINANCING TRANSACTIONS | ||
| Dividends paid to parent company shareholders | -7.879 | -7.999 |
| Dividends paid to minority shareholders of consolidated companies | 5.934 | -160 |
| Dividends paid to minority shareholders of consolidated companies | -6.214 | 0 |
| Capital increases or decreases in cash | 0 | -6.800 |
| Net new borrowings | 66.969 | 127.849 |
| Loan repayments | -51.303 | -65.945 |
| Change in cash flow from financing activities | 7.506 | 46.944 |
| 4/ IMPACT OF TRANSLATION DIFFERENCES | 31 | -109 |
| NET CHANGE IN CASH AND CASH EQUIVALENTS | -35.892 | -31.058 |
| OPENING NET CASH POSITION | 65.682 | 96.740 |
| NET CASH AND CASH EQUIVALENTS AT END OF PERIOD | 29.791 | 65.682 |
Income statement
| 2024 | 2023 | |
| Sales figures | 457.257 | 489.299 |
| Other products | 37.642 | 39.919 |
| Production and sales for the year | 494.899 | 529.218 |
| Purchases and other operating expenses | -387.946 | -438.678 |
| Staff costs (including employee profit sharing) | -54.312 | -49.981 |
| Taxes | -5.559 | -4.983 |
| Miscellaneous operating income and expenses | 6.788 | 5.146 |
| EBITDA | 53.870 | 40.722 |
| Net amortisation, depreciation and provisions | -20.758 | -11.185 |
| Impairment of goodwill | 0 | 0 |
| Operating profit after goodwill impairment | 33.112 | 29.537 |
| Net financial income | -13.153 | -7.843 |
| Exceptional items | -514 | -3.621 |
| Profit before tax | 19.445 | 18.072 |
| Income tax | -7.327 | -8.007 |
| Net income of consolidated entities | 12.118 | 10.065 |
| Share of profit of associates | 1.994 | 4.600 |
| Other comprehensive income | 1.588 | 0 |
| Consolidated net profit | 15.700 | 14.665 |
| Minority interests | -656 | -1.152 |
| Net profit (Group share) | 16.357 | 15.817 |
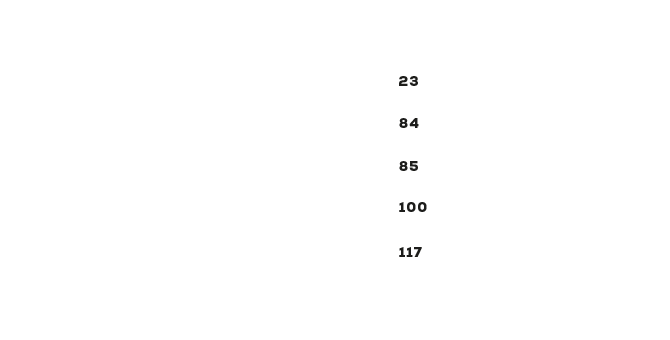
| Earnings per share, Group share (in euros) | 26,19218 | 23,52644 |
| Number of shares used for calculation | 672.301 | 672.301 |
| Diluted earnings per share, Group share | 26,19218 | 23,52644 |
| Number of shares used for calculation | 672.301 | 672.301 |
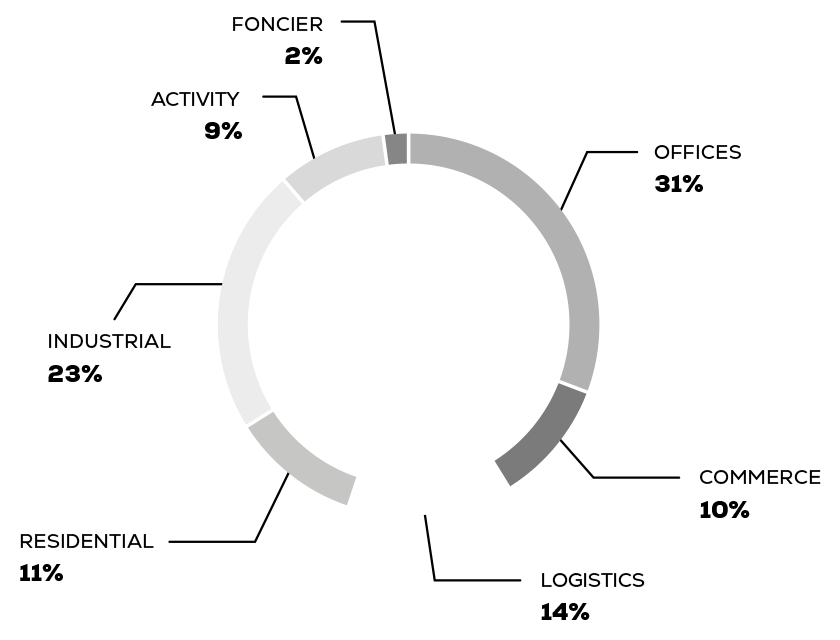
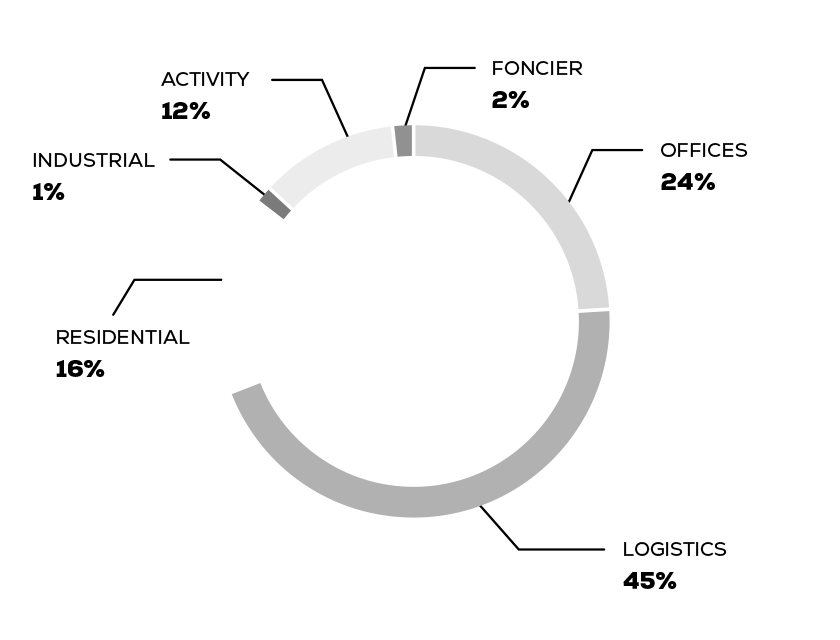
Breakdown of production by division
Property investment company
| VNC | Fair Value yc under construction | Adjusted debt | Unrealised capital gains | LTV | |
| Property investment company | 317.872 | 395.495 | 227.818 | 77.623 | 0,58 |
| Loan to value | 0,58 |
Asset values
Unrealised capital gains
Investment funds
We have slowed the pace of investment in 2024 in order to be able to support start-ups in our ecosystem that are in the process of raising intermediate funding (Gravithy, Holosolis, Heliup, Darwin Drones in particular). Nevertheless, new investment lines are appearing: Wind Capital, Syntetica, in the miscellaneous line for an average ticket of €250k.
| Securities held | Actions | Bonds convertible | Impairment | Fair Value 2024 | Fair Value 2023 |
| Holding division | 3.345 | -1.775 | 1.570 | 1.055 | |
| International Division | 1.136 | 1.136 | 1.078 | ||
| Investment Division | |||||
| Investment funds | 80.244 | 6.716 | -1.356 | 85.604 | 84.548 |
| Other / Egée Data Center | 254 | 1.321 | 1.575 | 1.575 | |
| Other / Miscellaneous | 2.054 | 2.054 | 890 | ||
| Other / Tourism / Tourism Hotel Clubs | 61 | 61 | 61 | ||
| Total Investment Division | 82.613 | 8.037 | -1.356 | 89.294 | 87.074 |
| 87.094 | 8.037 | -3.131 | 91.999 | 89.206 |
Key indicators
Average number of employees
| Effectifs | 2024 | 2023 | Variation | Variation en % |
| 617 | 586 | 31 | 5% |
Age pyramid